
Building better websites with the Chromium DevTools Issues Panel
Published on
19 Jun 2023
What feels like a very long time ago, I was leading the design, UX and front-end development for the open source project webhint.io. Webhint is a linting tool that helps improve your website’s accessibility, performance, security, and interop between browsers.
Sometime within the last two years, the web UI for webhint was retired, but there’s still a VS Code extension and a CLI tool, it is also the basis for what is now the Issues panel in the Chromium browser DevTools.
Accessing the Issues panel #
The browser DevTools are packed full of web development tools beyond the defaults that are shown when you open them up.
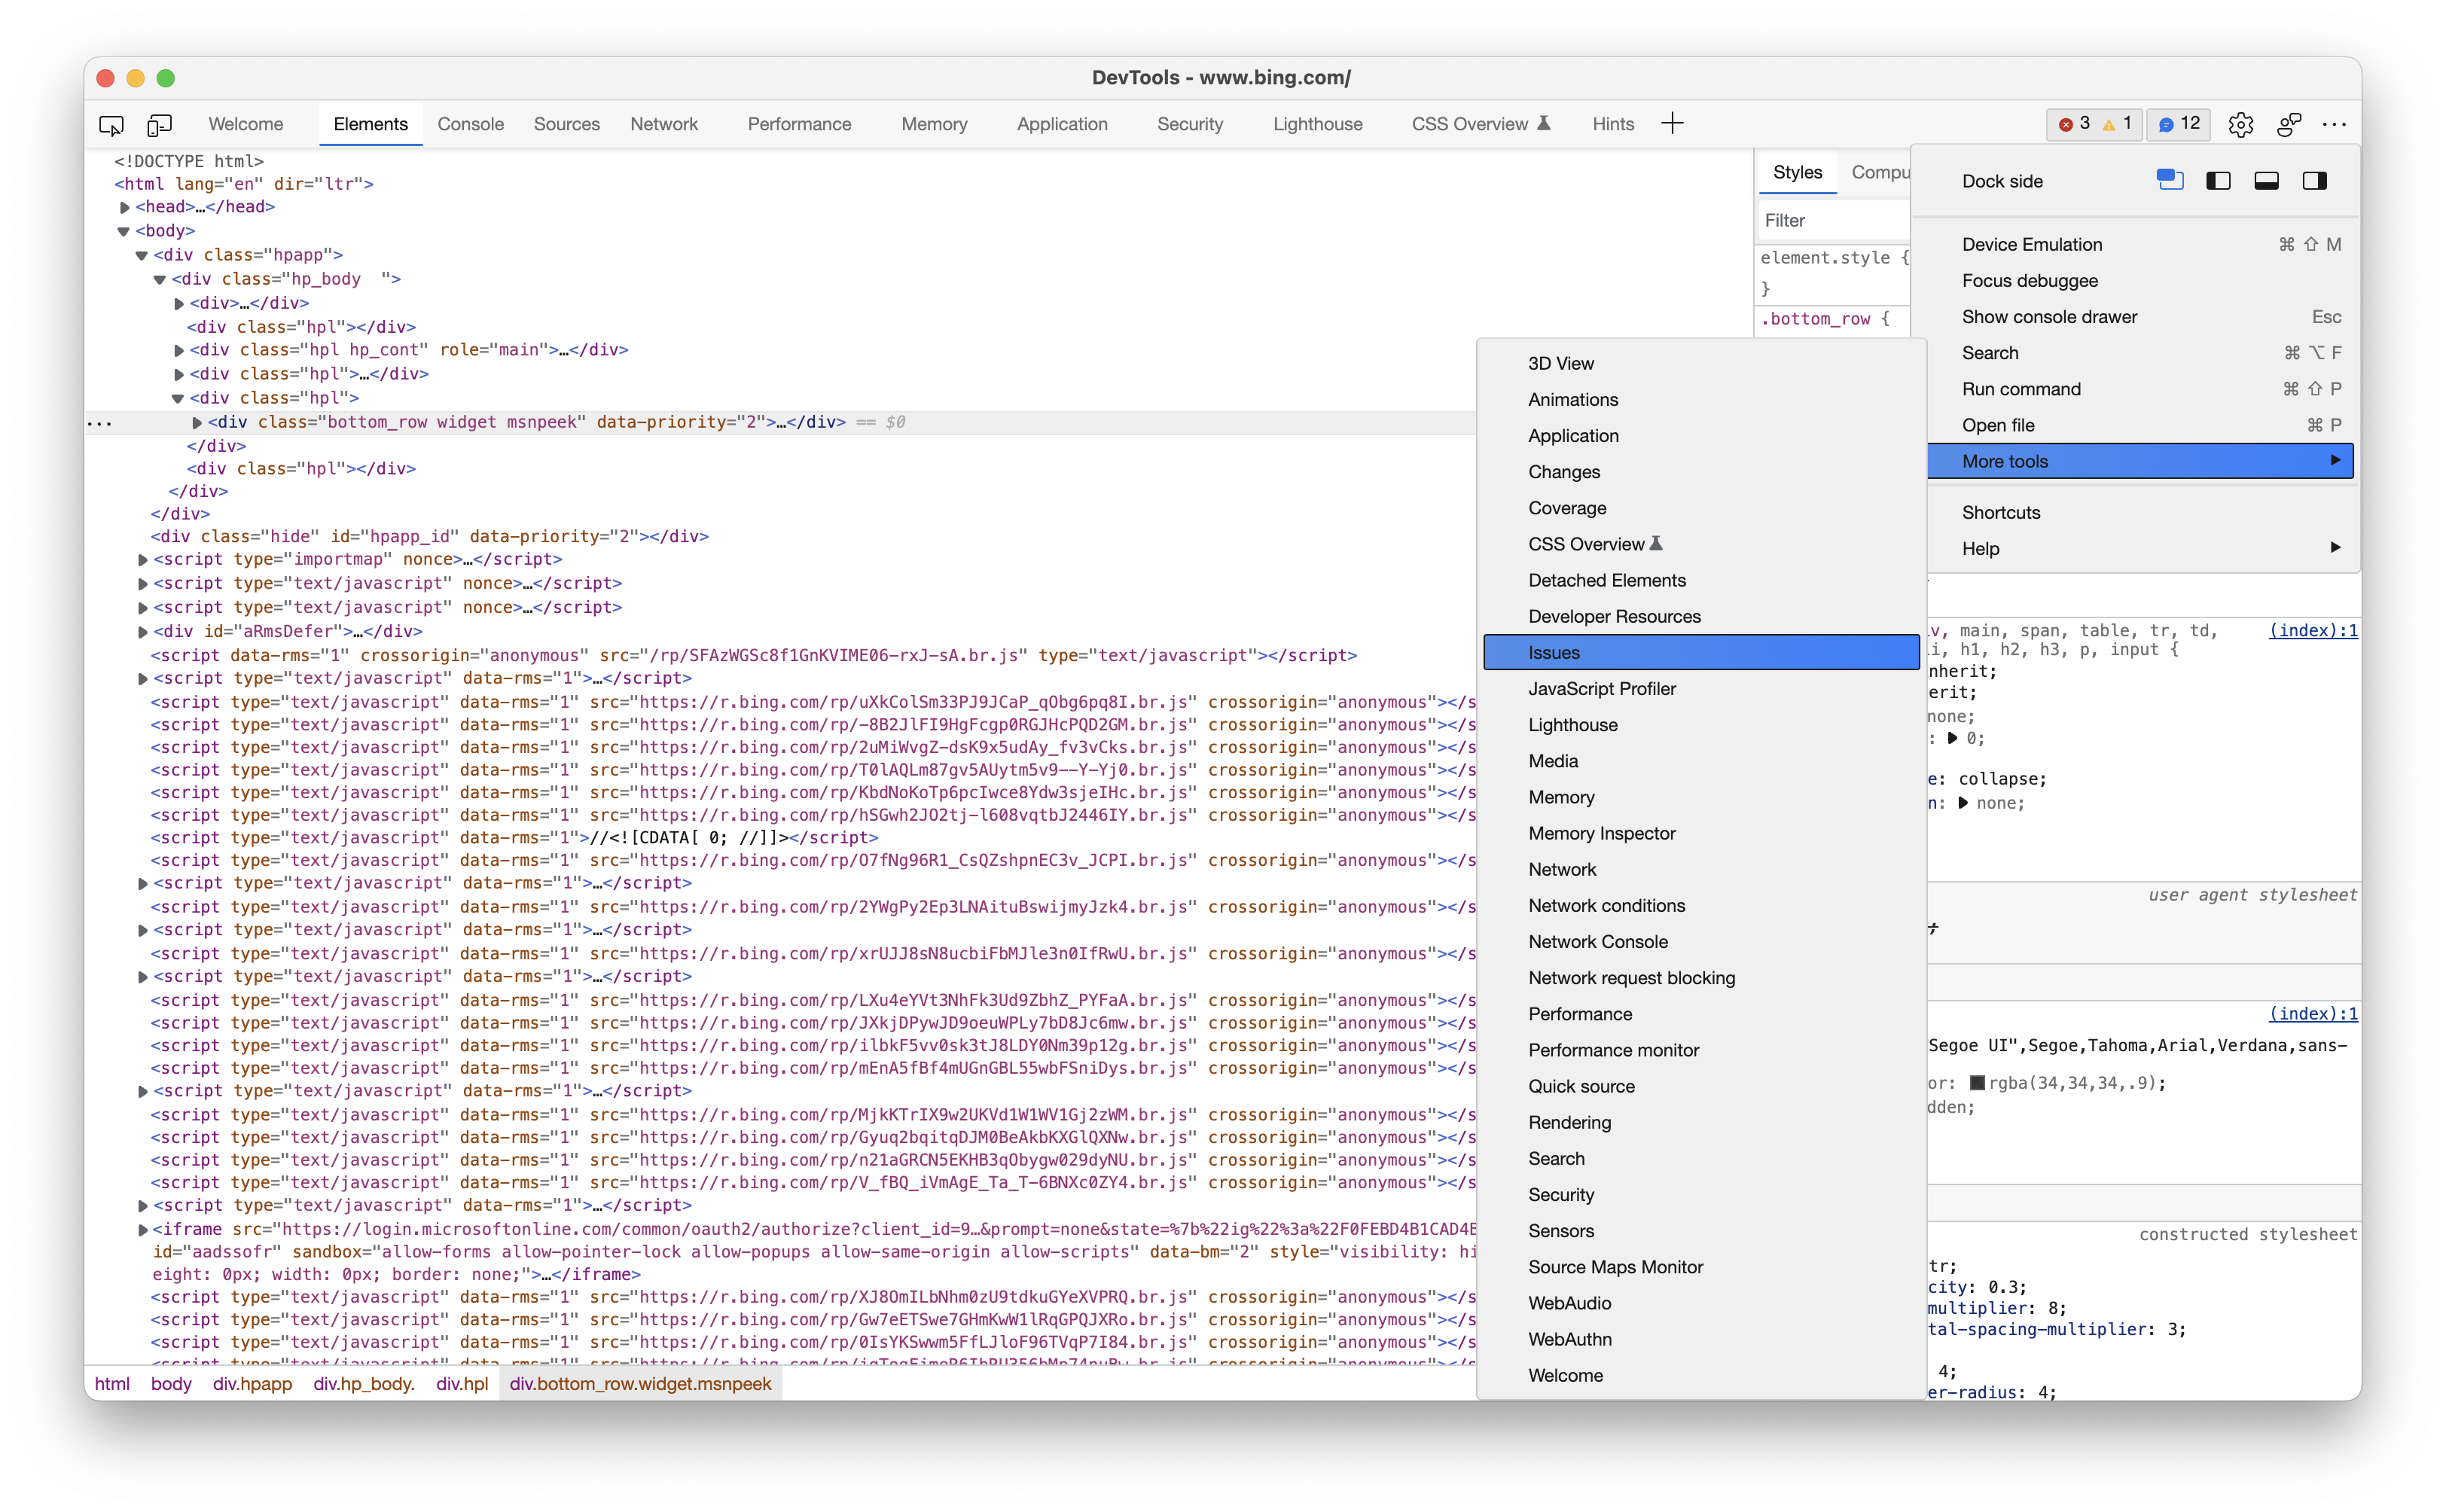
To access the Issues panel, find the 3 dots in the UI that open up a new menu. I’m in the Microsoft Edge developer tools, and this icon is located in the upper right hand corner.

Find the “More Tools” menu item and that will bring up a complete list of all the tools available in the browser in alphabetical order. Find the “Issues” panel in the list.
After you click on the Issues tool, it will show up in the bottom pane of the UI and if there’s anything amiss with the code you’re inspecting and it falls under one of the rules the Issues tool is checking for, it’ll appear there.

Filtering issues by severity and browser #
In the top toolbar of the lower pane, you can adjust your preferences for what kind of Issues you want to show up and for a handful of desktop and mobile browsers.
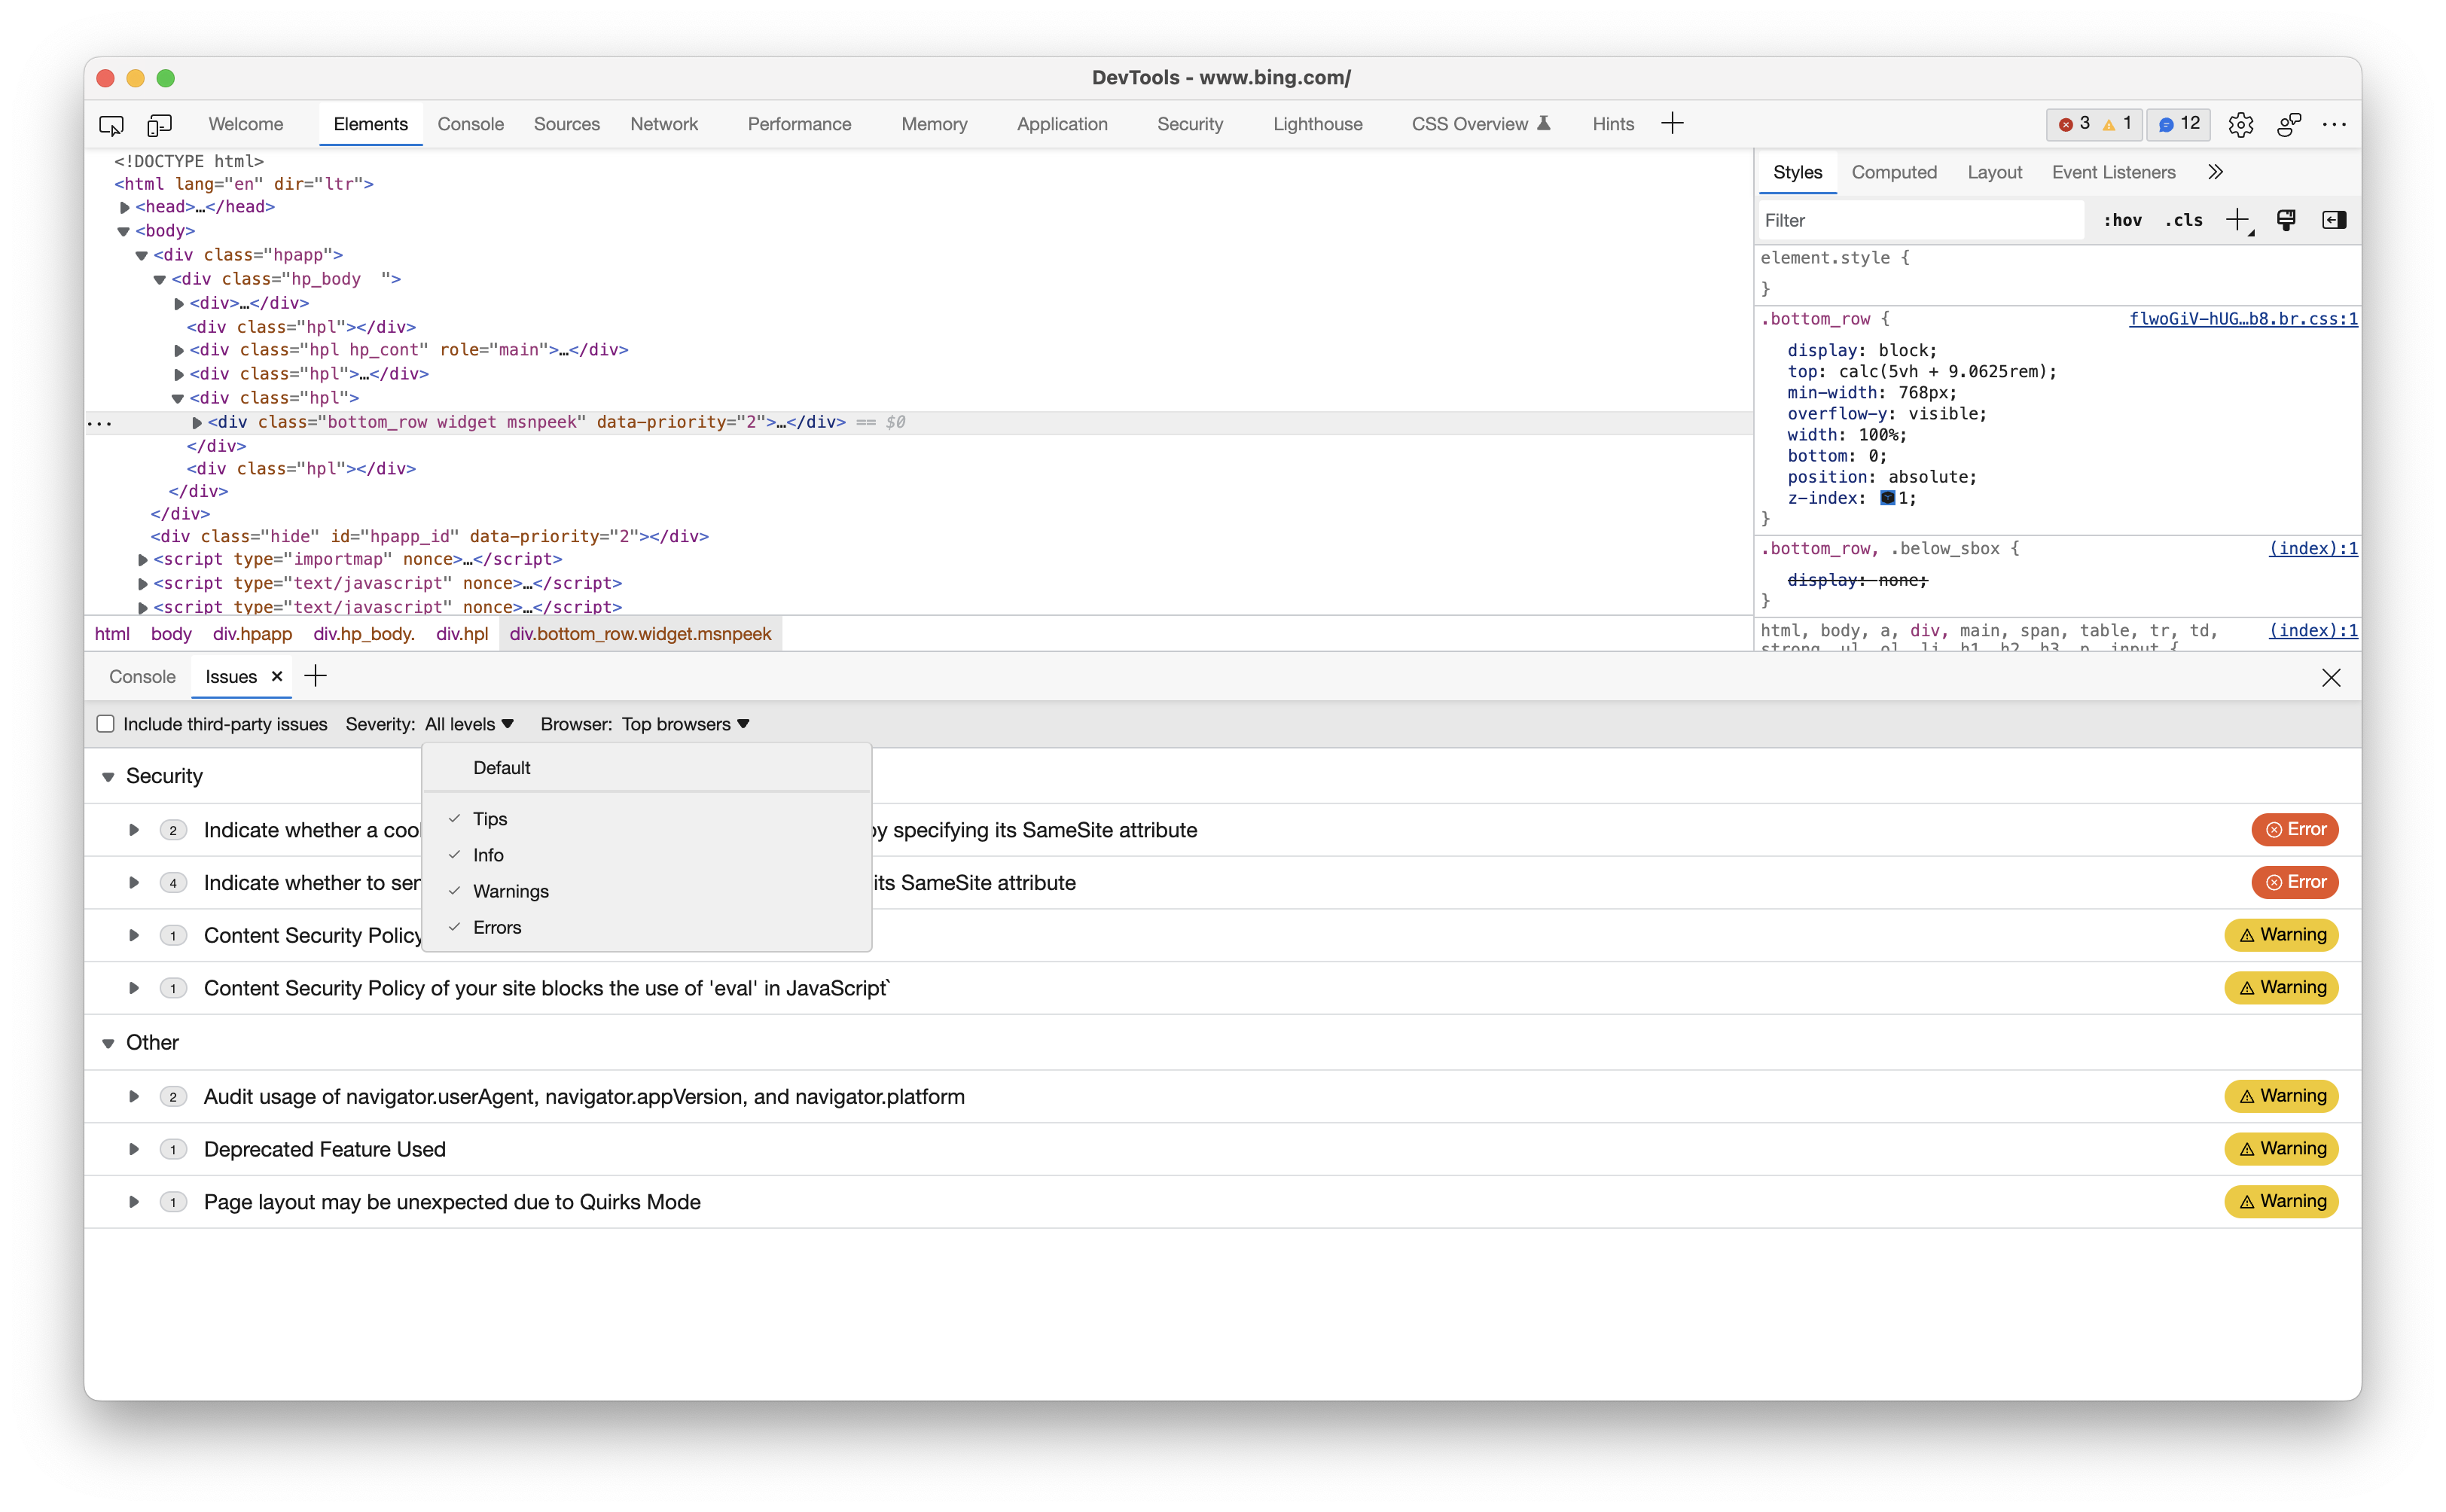
The different severity levels you can filter for are tips, info, warnings and errors. And the browsers you can target are Edge, Chrome, Firefox, Safari, Internet Explorer (support may be gone but it still lives on), and Opera on desktop. On mobile you can target Safari iOS, Chrome for Android, Firefox for Android, Samsung Internet, and Android Webview.

Expanding the issue will give you a description of what’s being reported, the resource that’s affected and a link out to some documentation so you can better understand what’s being reported and why you should care about it. It’s up to you to decide from there whether you’d like to fix it or not, but the issues reported on are there to help improve the code you’ve written and make the site a better experience.
Linting in your browser #
This tool brings linting straight to your browsers so you can get an idea of what needs to be worked on, if anything, in your codebase. If you need more robust linting though, you can use the webhint.io CLI to customize even further.
Happy building!
This article originally appeared on dev.to in November 2022
Follow me on Twitter or Mastodon for tech, travel and musings. I run The Web We Want, a place for web developers and designers to submit the things they need from browsers and the web platform to make their jobs easier. Author of Design for Developers. Subscribe to my newsletter to stay up to date with me, get interesting web platform and design related links, and occasional deals on my book and other merch sent to your inbox.